March 2021 was a watershed moment for the hospitality industry. As COVID-19 gained momentum, eating out changed dramatically, as dining rooms across every restaurant segment were closed to guests.
Since then, the industry has largely recovered, though there are clearly other issues in terms of supply chain and labor. While every brand was hit by the effects of the pandemic, enterprise brands that were able to shift to a digital-first approach reduced those impacts—and recovered quickly, as seen in our data and recent Growth Infographic.
It’s been quite a year for Qu too. Our modern, omni-channel ordering platform experienced a 5x increase in gross merchandise value (GMV) processed since the onset of the pandemic — underscoring the fact that technology has played a pivotal role in the recovery.
Check out the interesting data points below to see how things have changed over the last year and a half.

2020 – 2021: Year-over-Year Growth

To put it simply, Qu had a great year. In addition to a strong restaurant resurgence, new customer acquisitions and a large increase in our live store install base drove substantial increases in transaction totals, volume, and movement in our total platform sales. Keep reading to hear about the journey we took from the onset of the pandemic to this summer!
Year-over-Year Growth (YoY)

Early Pandemic Impacts

Things weren’t always so rosy, though. The initial impacts of the pandemic caused a 50% overall drop in total order volume, driven primarily by a 68% decrease in-store ordering. However, drive-thru and third-party ordering saw increases.
Total Order Volume per Channel

Three Months On: Stabilization

June saw an almost full recovery when the decline of sales shrunk from 50% to just 1% in June. 26% of stores remained closed in this timeframe; however, third-party, online ordering, and drive-thru picked up quite a bit.
Third-party, online ordering, and drive-thru all grew 3 months into pandemic

Sales Growth by Order Channel

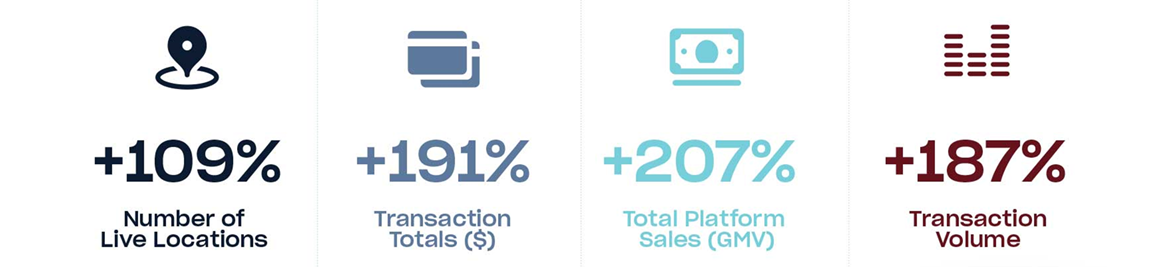
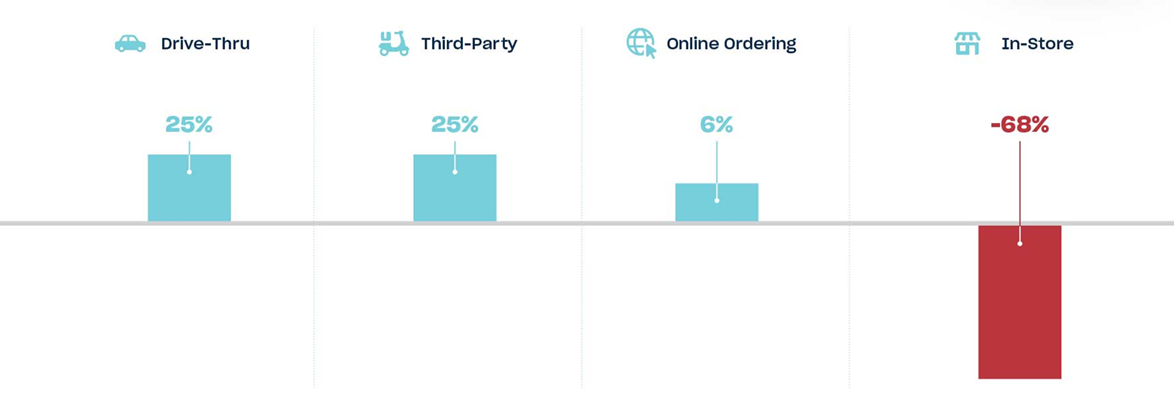
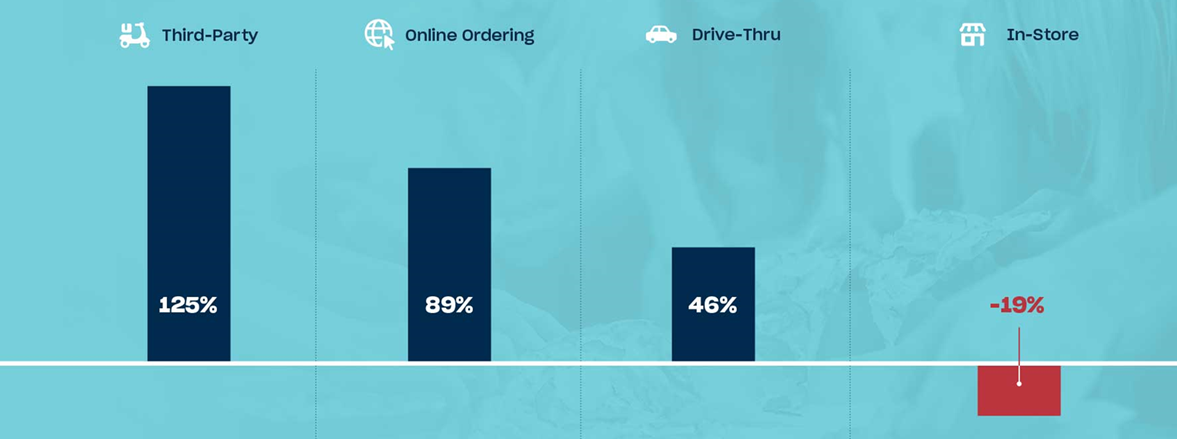
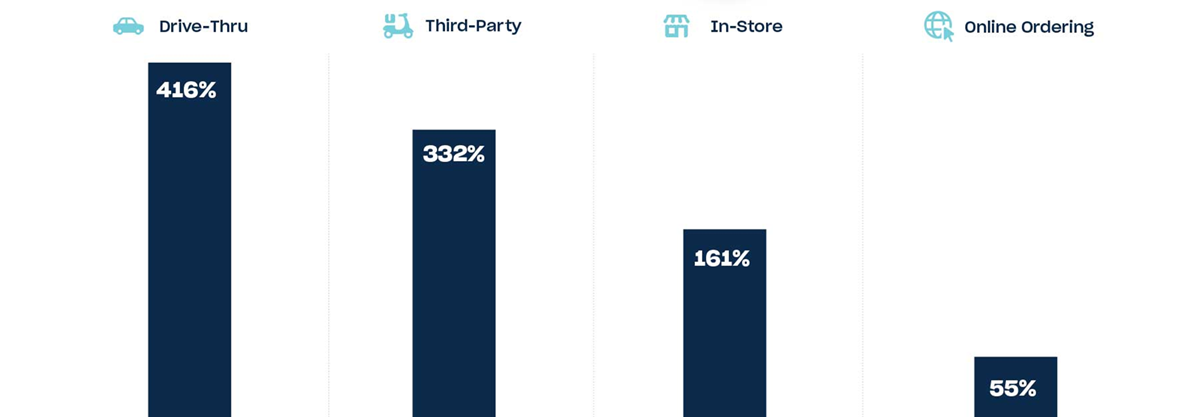
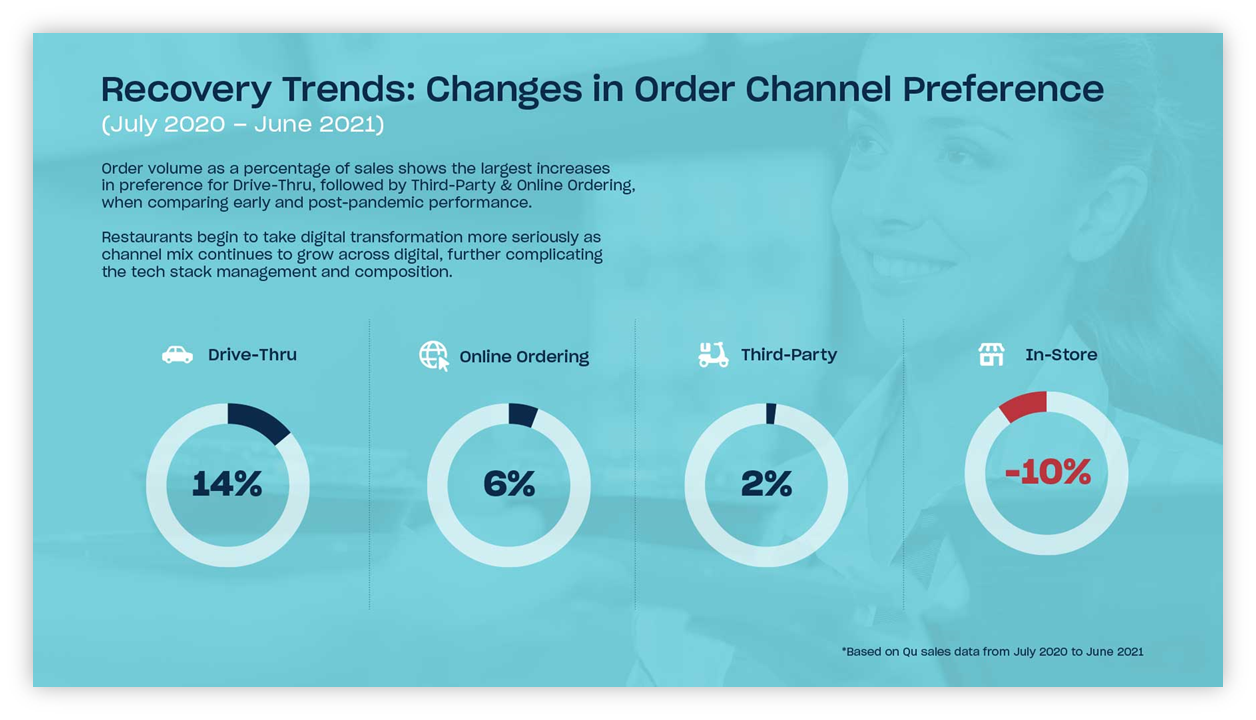
By June 2021, growth in total order volume processed by Qu reached 207%, driven by store re-openings, new customers and stores added to our platform, and guests going back to restaurants in full force. Drive-thru has quite obviously become a key revenue source and order channel for Fast Casual and Quick Service Restaurants.

Nonconventional channels became a key revenue source

A Shift in Channel Preference

From July 2020 to June 2021, customer tastes shifted towards off-premise and digital, further complicating restaurant operations and technology stack management. While in-store still represents the highest proportion of total sales, it registered a 10% decrease in volume on Qu’s platform, whereas drive-thru witnessed a nearly 15% increase.
Customer tastes shift towards off-premise & digital ordering channels

Qu’s Channel Mix: Share of Total Sales

While in-store remains the most popular channel, it’s not as popular as it used to be. Nearly half of all orders are now placed through the drive-thru, online ordering, and through third-party applications—and the trend towards off-premise is likely to continue into the future.
Nearly half of all orders are placed outside the restaurant.

Chicken is King

Chicken is now America’s most consumed meat, and that restaurant segment has also seen a meteoric rise in popularity. It’s now Qu’s top-performing category, followed by Soups & Salads, then Mexican/Mexican-inspired cuisine.
The top-performing category of food under Qu

Confronting Uncertainty with Technology

Although many enterprise brands have largely recovered from the effects of the pandemic, uncertainty is—and will continue to be—a challenge that restaurants will have to confront. From pricing volatility to labor shortages, the success of modern, agile restaurants amidst uncertainty demonstrates that swift, successful responses are often underpinned by a solid technological foundation.

Top 10 Components of a
Unified Commerce Platform

Scroll to Top